By Paul Theerman, Associate Director, Center for the History of Medicine and Public Health
“We now live in a time of endless possibility. More has been learned about the treatment of the human body in the last five years than was learned in the previous 500. Twenty years ago, 39 was the number of years a man could expect from his life. Today, it is more than 47.”1
So says the fictional character Dr. John Thackery on the first episode of Cinemax’s The Knick, a show set in New York in 1900. So the years and ages are thus: in 1880 newborn boys could expect a life of 39 years; in 1900, 47 years. And that’s about right. The technical term is life expectancy—the number of years that one could expect to live, with no substantial change of conditions. Dr. Thackery refers, grandiloquently, to those substantial changes of conditions that caused a dramatic increase in life expectancy in the developed world in the late 19th and early 20th centuries, and a steady increase thereafter. By 2010 U.S. life expectancy at birth stood at about 76 years for men, 81 years for women, with an average of 79 years overall.2
The individual who put such statistical work on a firm footing, institutionally and intellectually, was William Farr (1807–1883), statistician in Great Britain’s General Register Office from 1839 to 1879. The British government set up the Register Office in 1837 as part of a reform agenda to provide for civil—rather than parish-based—registration of births, marriages, and deaths. Farr was a medical doctor of modest background who found statistics fascinating. Three times Farr prepared life tables for England and Wales, providing life expectancies divided along gender and geographical lines, and basing his work on the burgeoning data collected in his office and through the expanded decennial censuses beginning in 1841. He was also instrumental in checking and confirming John Snow’s famous geographical detection of the source of the London cholera outbreak of 1853, based on mortality statistics.3
Farr was not the first to determine how to calculate life expectancy: that feat is general accorded to Edmond Halley, the early modern astronomer who predicted the return of the comet that bears his name. But while not the first to approach the topic, Farr may have been the most serious and articulate advocate of life expectancy as a measure of national health:
Since an English life table has now been framed from the necessary data, I venture to express a hope that the facts may be collected and abstracted, from which life tables of other nations can be constructed. A comparison of the duration of successive generations in England, France, Prussia, Austria, Russia, America, and other States, would throw much light on the physical condition of the respective populations, and suggest to scientific and benevolent individuals in every country—and to the Governments—many ways of diminishing the sufferings, and ameliorating the health and condition of the people; for the longer life of a nation denotes more than it does in an individual—a happier life—a life more exempt from sickness and infirmity—a life of greater energy and industry, of greater experience and wisdom.4

A life table from Vital Statistics. The table, published in 1843 as part of the fifth report, refers to the year 1841.
Farr expected “a noble national emulation,” that is, a competition for best life expectancy, to generate as much enthusiasm as “victories over each other’s armies in the field.” His vision—at least of comparative data—came true: today the World Health Organization provides life expectancies for 194 countries.5

The cover of the NYAM edition of Vital Statistics.
The centrality of Farr’s work to the mission of The New York Academy of Medicine led to NYAM’s reprinting Vital Statistics: A Memorial Volume of Selections from the Reports and Writings of William Farr (1885) in 1975.
As for Dr. John Thackery’s paean to modern medicine: it is a bit misplaced. He was right in stating that medical treatments, and especially surgical techniques, made great advances in his time. But that fact didn’t account for the change in life expectancy. Instead, “old knowledge” was more important: people fell ill and died due to poor sanitation, inadequate diet, dangerous working conditions, and the risks of childbirth and infancy. For example, in 1850 life expectancy in Massachusetts for newborn boys was 38, while 20-year-olds could expect to live to 62, 40-year-olds to 68, and 60-year-olds to 76. By 1900, the comparable figures are: newborns, 48; 20-year-olds, 61; 40-year-olds, 67; and 60-year-olds, 74.6 The situation for newborns improved greatly over the course of 50 years, but for older cohorts, little changed. Over time, the great dangers in childbirth and the first years of life had been ameliorated, and better obstetrics was part of the story, but public health made the difference.
References
1. “The Knick,” Cinemax, Series 1, Episode 1 (aired August 8, 2014), as quoted in NPR, “A New Show about Doctors of Old,” broadcast August 3, 2014, http://www.npr.org/2014/08/03/337531248/a-new-show-about-doctors-of-old, accessed August 14, 2014.
2. The Henry J. Kaiser Foundation, “State Health Facts: Life Expectancy at Birth (in years), by Gender” http://kff.org/other/state-indicator/life-expectancy-by-gender/, accessed August 14, 2014.
3. This and other information on Farr are from the editors’ “Introduction” (pp. iii–xiv), and the original “Biographical Sketch” (pp. vii–xxiv, separately paginated), in Vital Statistics: A Memorial Volume of Selections from the Reports and Writings of William Farr, with an Introduction by Mervyn Susser and Abraham Adelstein, The History of Medicine Series Issued under the Auspices of the Library of the New York Academy of Medicine, no. 46 (1885; reprint ed., Metuchen N.J.: The Scarecrow Press, 1975).
4. Vital Statistics, 453, quoting the Registrar General’s Fifth Annual Report (August 1843).
5. World Health Organization, Global Health Observatory Data Repository, http://apps.who.int/gho/data/view.main.60080?lang=en, accessed August 14, 2014.
6. Historical Statistics of the United States, 1789–1945: A Supplement to the Statistical Abstract of the United States (Washington: United States Department of Commerce, Bureau of the Census, 1949), page 45, Series C 6 21. “Vital Statistics—Complete Expectation of Life: 1789 to 1945.” http://www2.census.gov/prod2/statcomp/documents/HistoricalStatisticsoftheUnitedStates1789-1945.pdf, accessed August 14, 2014.

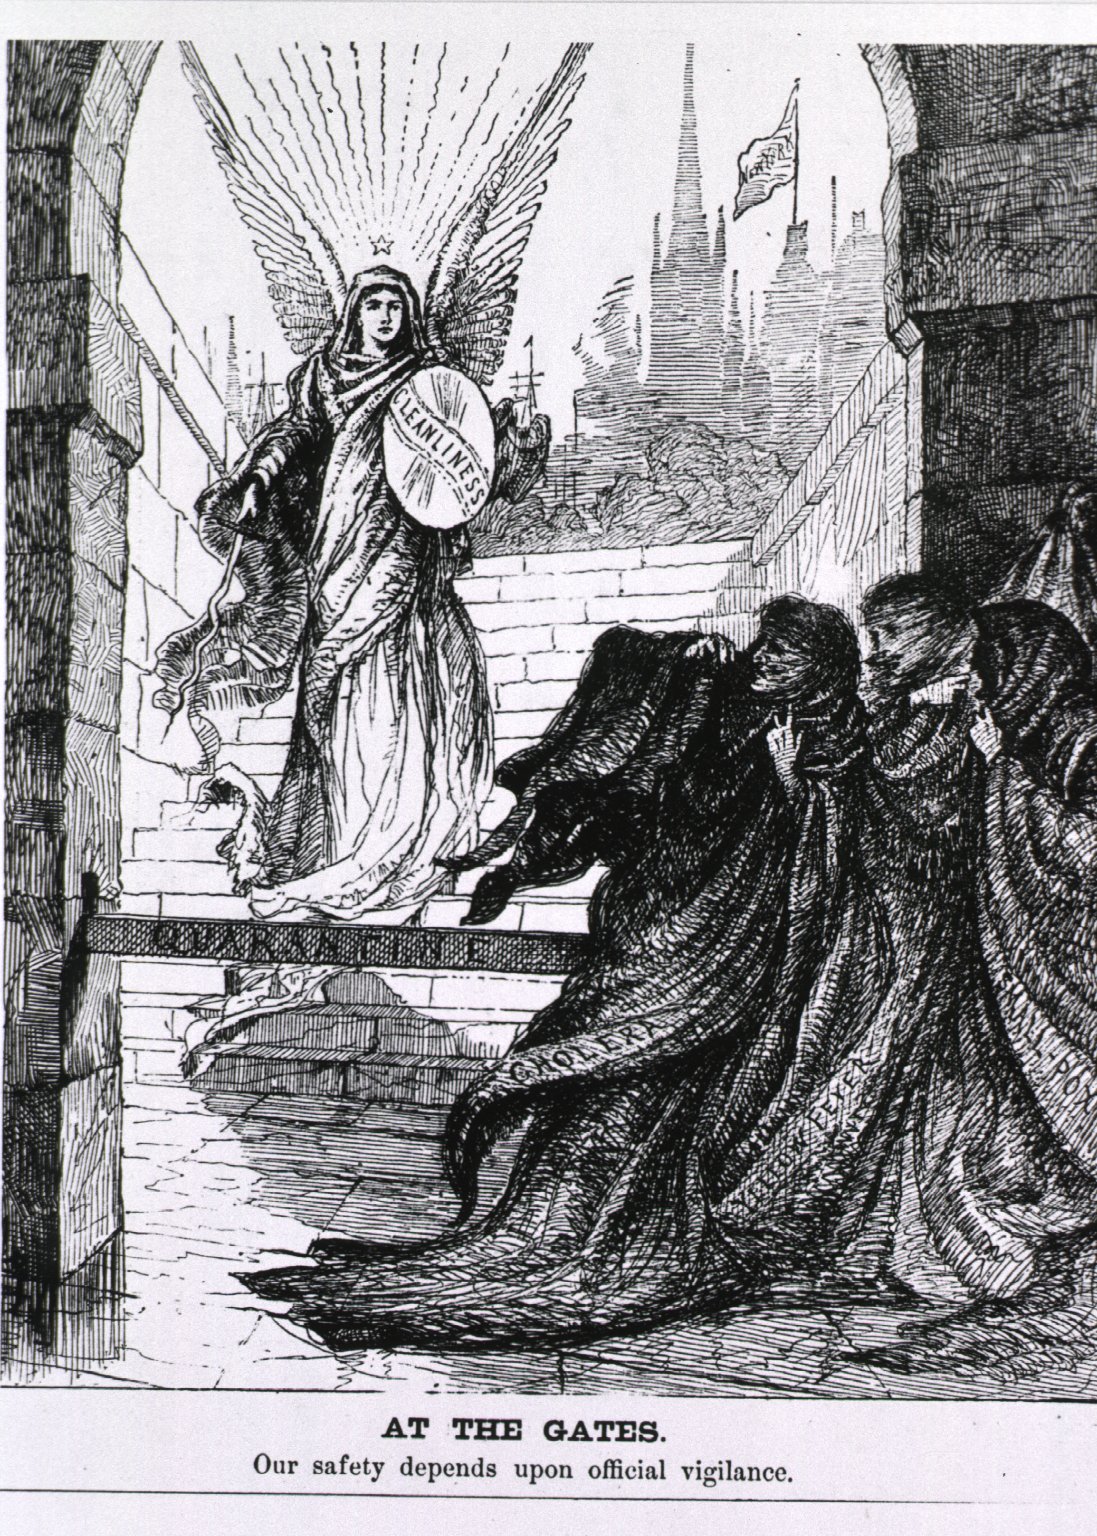
![Poultney Bigelow, The Pest at Our Gates, ([New York] : Merchants’ Association of New York, [1908])](https://nyamcenterforhistory.org/wp-content/uploads/2014/08/pestatourgates1908_watermark.jpg)